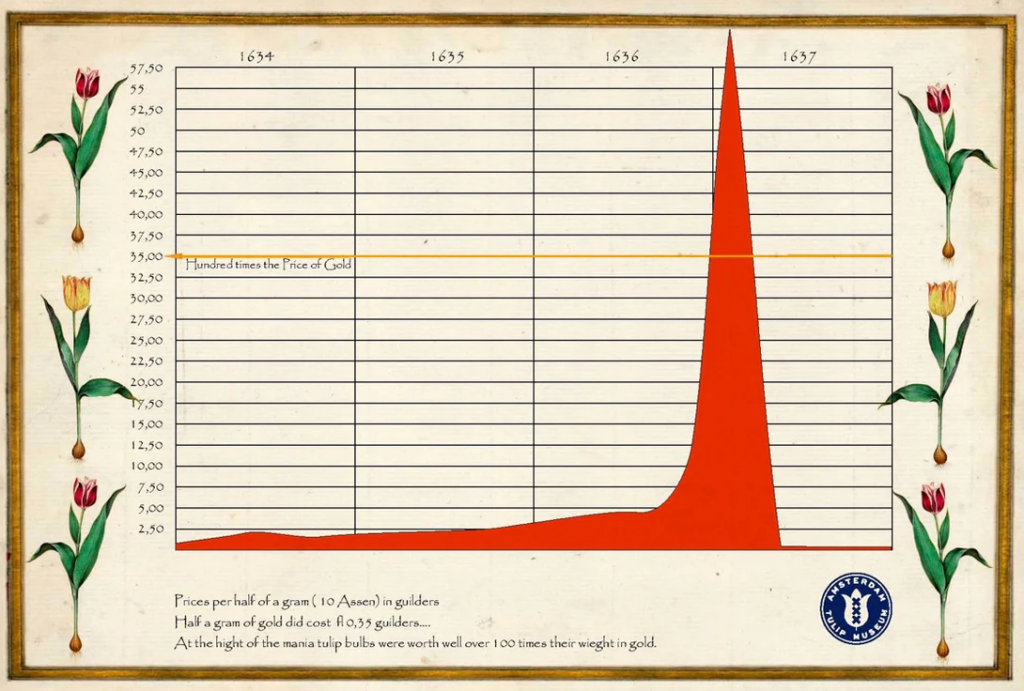
In the 1630s, the Dutch Republic was gripped by an extraordinary financial phenomenon known as Tulip Mania. Tulip bulbs became so coveted that their prices skyrocketed, with some rare varieties fetching sums equivalent to luxurious houses. At its peak, a single bulb could sell for more than 10 times the annual income of a skilled craftsman.
However, this bubble burst spectacularly in February 1637, leaving many investors ruined. Had modern trend analysis tools been available, traders might have spotted the unsustainable uptrend and the signs of an impending reversal, potentially avoiding catastrophic losses.
Today’s financial markets are vastly more sophisticated, but the fundamental concept of identifying and following trends remains crucial for traders. Whether you are dealing in stocks, commodities, or cryptocurrencies, understanding trend analysis and employing effective trend trading strategies can significantly enhance your trading performance.

Trend analysis is the process of examining historical price data to identify patterns and predict future price movements. At its core, it’s about recognising the direction in which an asset’s price is moving over time.
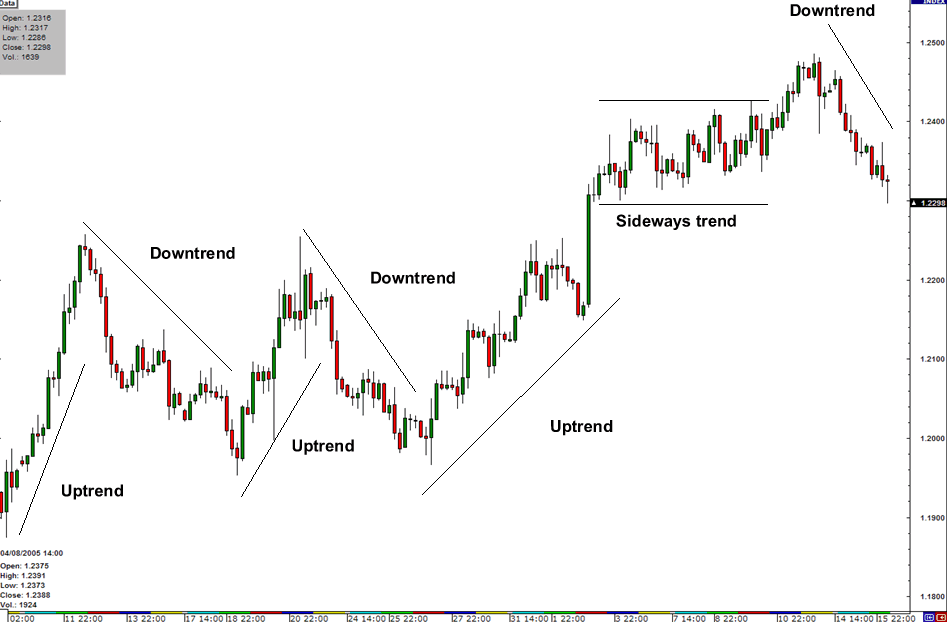
There are three primary types of trends:
1. Uptrends: Characterised by higher highs and higher lows.
2. Downtrends: Marked by lower highs and lower lows.
3. Sideways trends: When prices move within a horizontal range.
It’s important to note that trends can exist across various timeframes – from minutes to years. A stock might be in a long-term uptrend on a weekly chart but experiencing a short-term downtrend on a daily chart. This multi-timeframe nature of trends underscores the importance of clearly defining your trading horizon.

Several tools can help traders identify and confirm trends.
Moving averages
These smooth out price data to create a single flowing line, making trends easier to spot. The two most common types are:
Trendlines and channels
Trendlines are drawn by connecting a series of highs or lows. When prices move between two parallel trendlines, it forms a channel. These visual tools help traders see the overall direction and potential support/resistance levels.
Technical indicators
These mathematical calculations based on price and/or volume can provide additional insights. Popular ones include:
For example, if the price of Apple stock is consistently staying above its 50-day moving average, and the MACD line is above its signal line, these could be strong indications of an uptrend.

Spotting the beginning of a trend early can lead to significant profits, but it’s not always straightforward. Here are some key points to consider:
1. Look for a series of higher highs and higher lows for an uptrend, or lower highs and lower lows for a downtrend.
2. Confirm the trend with multiple indicators. For instance, an uptrend might be confirmed when prices are above a moving average, and the RSI is above 50.
3. Be aware of potential trend reversals. These often start with a failure to make a new high (in an uptrend) or a new low (in a downtrend).
Remember, no single indicator is foolproof. Always look for confirmation from multiple sources before making trading decisions.
Once you’ve identified a trend, how do you profit from it? Here are three common strategies.
Trend following
This strategy involves entering trades in the direction of the established trend. Traders might buy when the price crosses above a moving average in an uptrend, or sell when it crosses below in a downtrend.
Breakout trading
This involves entering a trade when the price breaks through a significant level, anticipating that the breakout will lead to a new trend.
Pullback trading
In this strategy, traders wait for a temporary move against the trend (a pullback) before entering in the direction of the main trend.
For instance, in an uptrend, a trader might wait for the price to pull back to a rising trendline or a key moving average before buying, anticipating that the uptrend will resume from this level.

While trend trading can be profitable, it’s crucial to manage risks effectively:
1. Always use stop-loss orders to limit potential losses. In trend trading, these are often placed just below recent swing lows (for longs) or above recent swing highs (for shorts).
2. Proper position sizing is vital. Never risk more than a small percentage (many professionals suggest 1-2%) of your trading capital on a single trade.
3. Avoid over-leveraging. While leverage can amplify profits, it can also lead to substantial losses if a trade goes against you.
Remember, no trend lasts forever, and even the strongest trends will have counter-trend moves. Always be prepared for the unexpected.
In conclusion, trend analysis and trend trading strategies are powerful tools in a trader’s arsenal. By learning to identify trends, confirm them with multiple tools, and apply appropriate trading strategies, you can enhance your trading performance. However, always remember that trading carries inherent risks. Practice these techniques with a demo account, continually educate yourself, and always trade within your risk tolerance.
Ready to apply these strategies in real markets? Open a live account with VT Markets today. With advanced charting tools and a wide range of assets, VT Markets provides an ideal platform for trend traders. Start your journey now, but remember to trade responsibly.