In the not-so-distant past, Forex trading was primarily driven by intuition, market experience, and fundamental analysis. However, the introduction of Forex chart indicators revolutionised the landscape, providing traders with a powerful analytical tool that transformed decision-making.

Forex chart indicators brought a scientific approach to trading, enabling traders to objectively analyse historical price data and predict potential future price movements. Traders could now identify patterns, trends, and market behaviour, allowing for more accurate entry and exit points. This shift from gut-feeling trading to data-driven analysis was similar to shedding light on a previously dimly lit path.
By empowering traders with a plethora of indicators from Moving Averages to Bollinger Bands, RSI, MACD, and more – charting tools equipped them with a deeper understanding of market dynamics. These indicators acted as beacons, illuminating market trends, volatility, and momentum. Traders could fine-tune their strategies, manage risk, and optimise their trades for greater profitability.
Furthermore, the advent of technology, especially online trading platforms democratised access to these indicators. What was once exclusive to institutional traders and professionals became readily available to individual traders. Now, traders, whether seasoned or beginners, could harness the power of chart indicators to level the playing field.
Today, Forex chart indicators are an integral part of every trader’s toolkit. They have shifted trading from speculative guessing to informed decision-making, contributing to the growth and accessibility of the Forex market. This evolution underscores the profound impact of technology and analytics on the financial world, ushering in a new era of possibilities for traders around the globe.
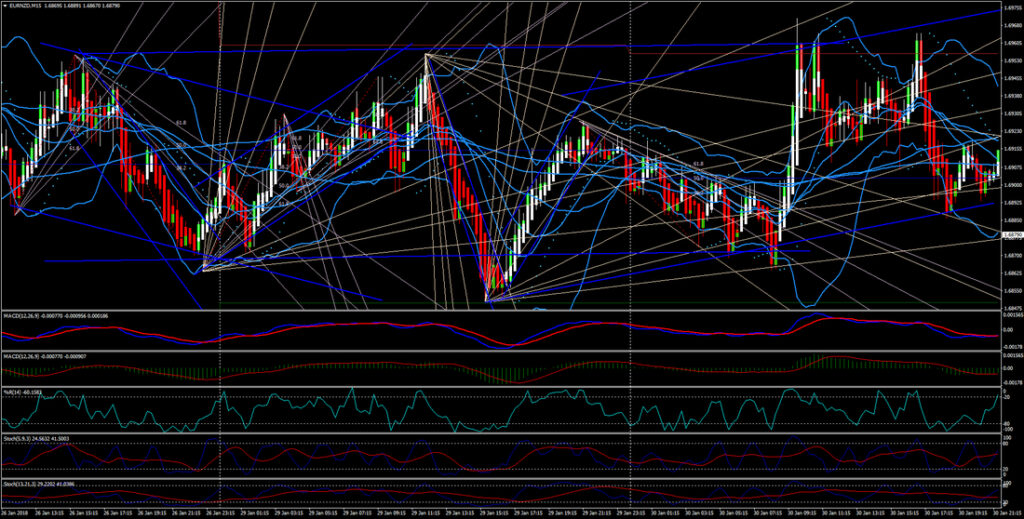
Chart indicators are fundamental tools used in financial analysis, specifically in the domain of Forex trading. These tools are grounded in mathematical calculations and are applied to a variety of market data, such as price and volume, to provide insights into market trends and potential future price movements.
The primary objective of chart indicators is to assist traders in understanding the complex dynamics of the market and to aid in the development of effective trading strategies. Through careful interpretation of these indicators, traders can make informed predictions about the likely changes in price, enabling them to execute timely decisions to either maximise gains or minimise losses.
At the core of chart indicators lies mathematical algorithms. These algorithms process historical and real-time market data to generate specific values, often displayed on charts, that traders can analyse. The calculations involved in these indicators may consider various parameters, including price, volume, or a combination of both, depending on the type of indicator being used.

Chart indicators function as a lens that magnifies and simplifies the intricate market dynamics. They help traders identify patterns, trends, and potential turning points, giving a clear view of the market’s behaviour. For example, a moving average smoothes out price data, revealing the underlying trend more clearly.
Understanding market dynamics is pivotal in devising successful trading strategies. Chart indicators equip traders with crucial information, allowing them to strategise their trades. For instance, an RSI reading above 70 might indicate an overbought market, prompting traders to consider selling, while a reading below 30 could suggest an oversold market, potentially signalling a buy opportunity.
The ultimate goal of employing chart indicators is to foresee how prices might change in the future. By interpreting these indicators and recognising patterns or signals, traders gain insights into potential price shifts. This foresight enables them to make timely decisions – be it entering or exiting a trade – aiming to maximise profits during price upswings and mitigate losses during downturns.
Before delving deeper into the world of Forex chart indicators, it’s essential to understand the diverse range of tools available to traders. In this section, we’ll explore an array of popular chart indicators, each with its unique characteristics and insights into market behaviour. These indicators serve as essential instruments for traders, providing valuable signals and helping navigate the complex Forex landscape with confidence.
Moving averages are foundational in technical analysis, smoothing price data for a clear trend representation over a specified time frame. Types include Simple Moving Averages (SMA), Exponential Moving Averages (EMA), and Weighted Moving Averages.
SMAs give equal weight to each price point, suitable for trend identification. EMAs prioritise recent prices, making them responsive to market shifts. Weighted Moving Averages emphasise specific data points, allowing flexible customisation. Traders experiment with these types to match their strategy and market conditions.
RSI, a key momentum indicator, gauges both the speed and change of price movements within a given period. By doing so, it provides traders with valuable insights into overbought and oversold conditions, aiding in the assessment of potential trend reversals or continuations.
RSI values above 70 usually suggest overbought conditions, implying a possible price correction or trend reversal, while values below 30 typically indicate oversold conditions, potentially signalling a buying opportunity. This indicator serves as a critical tool in a trader’s toolkit for understanding market sentiment and making informed decisions.
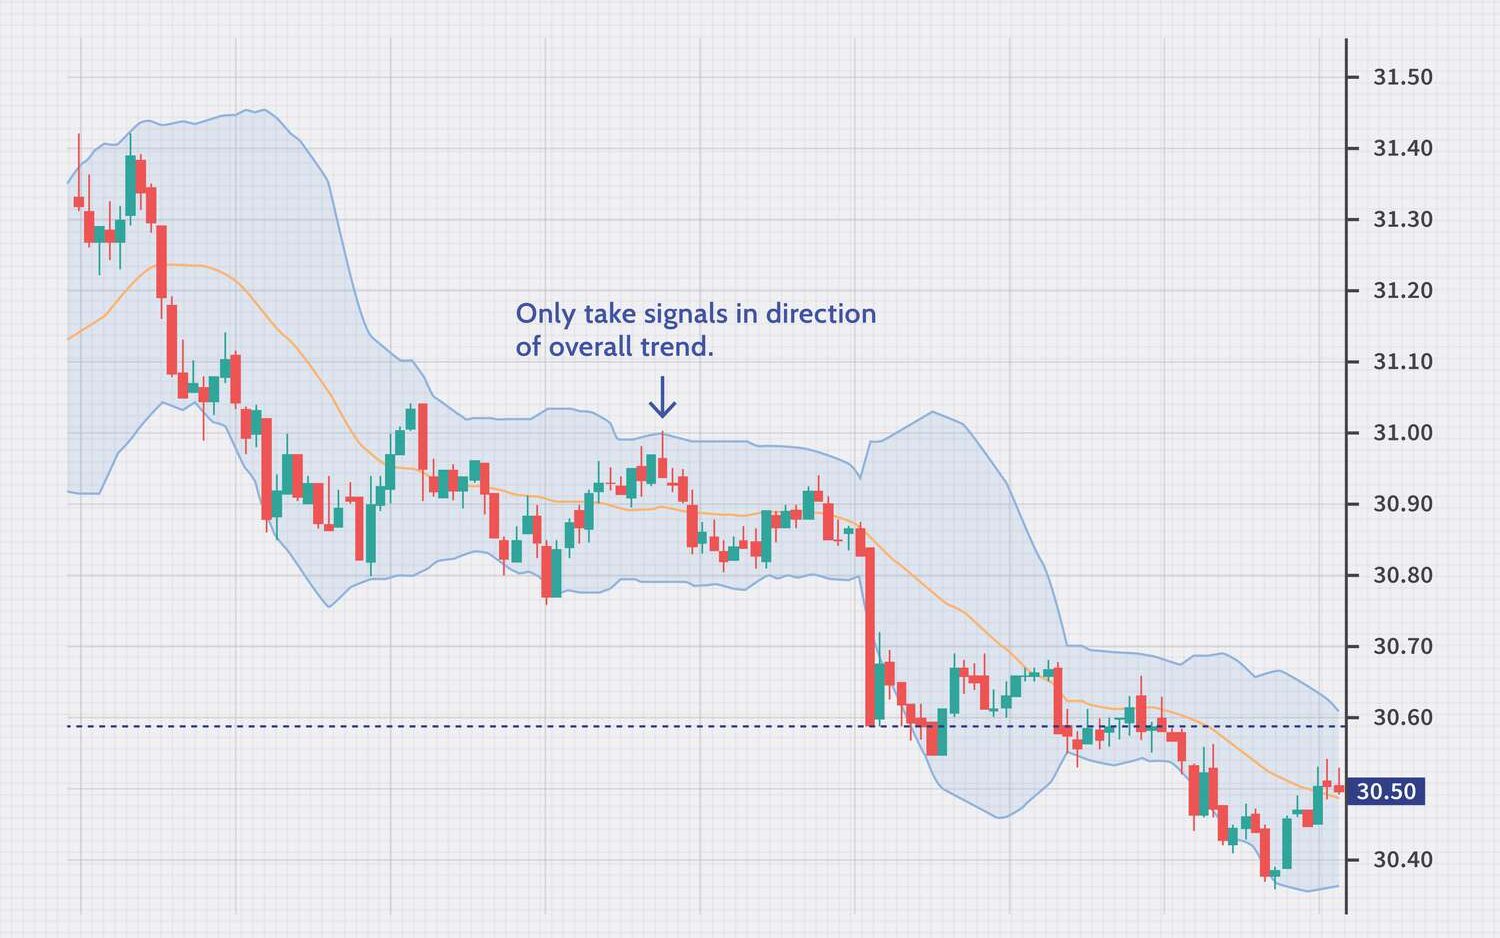
Bollinger Bands, a widely-used volatility indicator, consist of a middle band, typically a 20-day simple moving average (SMA), flanked by an upper and lower band. The upper band is calculated by adding two times the 20-day SMA’s standard deviation to the SMA, while the lower band is obtained by subtracting two times the standard deviation from the SMA.
These bands dynamically adjust to market volatility, widening during volatile periods and narrowing during calmer phases. When prices approach the upper band, it may signify overbought conditions, potentially indicating a sell opportunity, while nearing the lower band may suggest oversold conditions, hinting at a buy opportunity.
MACD is a versatile indicator illustrating the relationship between two moving averages, highlighting changes in market momentum. It’s calculated by subtracting the 26-day exponential moving average (EMA) from the 12-day EMA, resulting in the MACD line. A 9-day EMA of the MACD line, called the signal line, identifies buy or sell signals.
When the MACD line crosses above the signal line, it generates a bullish signal, suggesting a potential uptrend, and vice versa for a bearish signal. The histogram, representing the difference between the MACD line and the signal line, visualises trend strength and direction. Traders use MACD to identify entry and exit points, aiding in informed trading decisions.
The Stochastic Oscillator, a momentum indicator, compares a security’s closing price to its price range over a specified time period, typically 14 periods. It generates values between 0 and 100, indicating the closing price’s position within the price range.
A value near 0 indicates that the closing price is at the low end of the range, signifying potential oversold conditions, while a value near 100 suggests the closing price is at the high end of the range, hinting at potential overbought conditions. Traders use this information to identify possible trend reversals or continuation patterns, aiding in strategic decision-making.
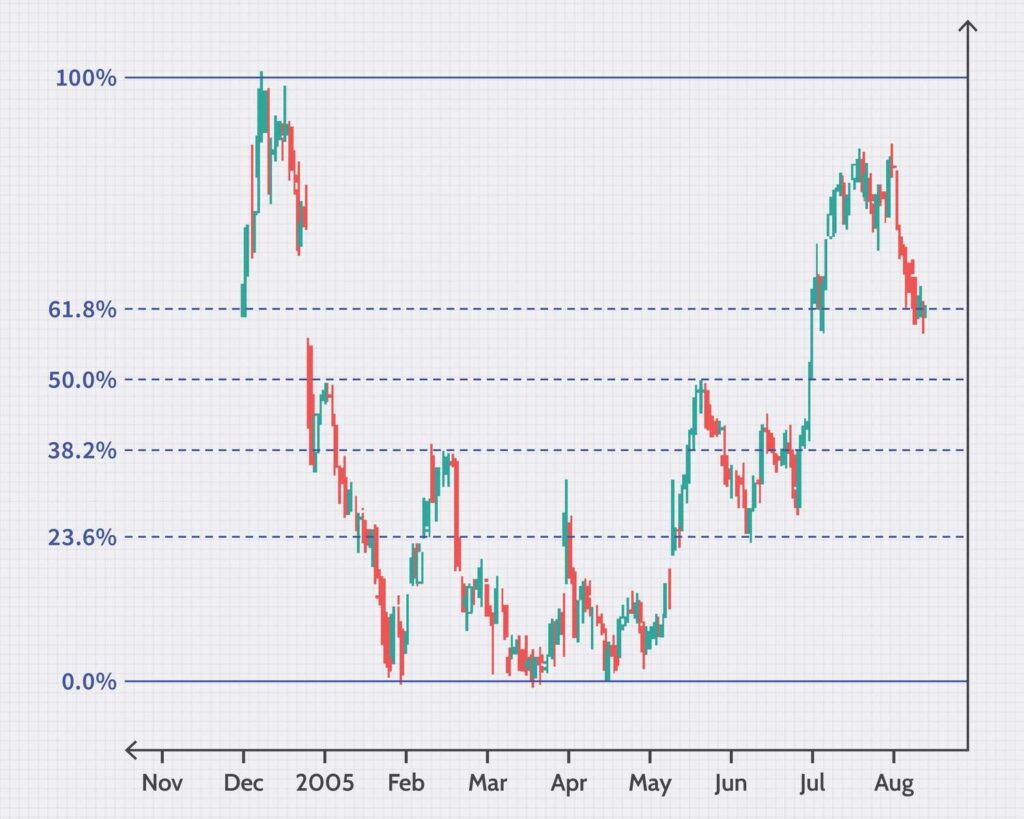
Fibonacci Retracement, a widely utilised tool, employs horizontal lines to identify crucial areas of potential support or resistance based on key Fibonacci levels. These levels – notably 23.6%, 38.2%, 50%, 61.8%, and 78.6% – are derived from the Fibonacci sequence.
Traders utilise these retracement levels to gauge possible points of price reversal or continuation, assisting in making informed trading decisions.
The Ichimoku Cloud, a comprehensive technical indicator, offers a holistic view of support/resistance levels, trends, and momentum. It consists of several components, including the cloud (or “Kumo”), Tenkan-sen, Kijun-sen, Senkou Span A, and Senkou Span B.
The cloud represents an area of potential support or resistance, providing traders with valuable insights into market trends and aiding in the identification of potential trade opportunities based on the relationship between the components and the price.
The Keltner Channel, a volatility-based indicator, is a powerful tool used to assess market volatility and potential trend reversals. It consists of an upper band, calculated by adding the average true range (ATR) of an asset to a simple moving average (SMA), and a lower band, obtained by subtracting the ATR from the SMA.
When prices approach the upper band, it indicates increased volatility and a potential trend reversal, offering traders valuable information for their trading strategies.
The Parabolic SAR (Stop and Reverse) is a versatile technical indicator designed to identify potential entry and exit points in a market. It places dots either above or below the price chart, indicating potential trend changes.
When the dots are above the price, it suggests a downward trend, signaling a possible sell opportunity. Conversely, when the dots are below the price, it indicates an upward trend, suggesting a potential buy opportunity. Traders use these signals to make informed decisions and effectively manage their trades.
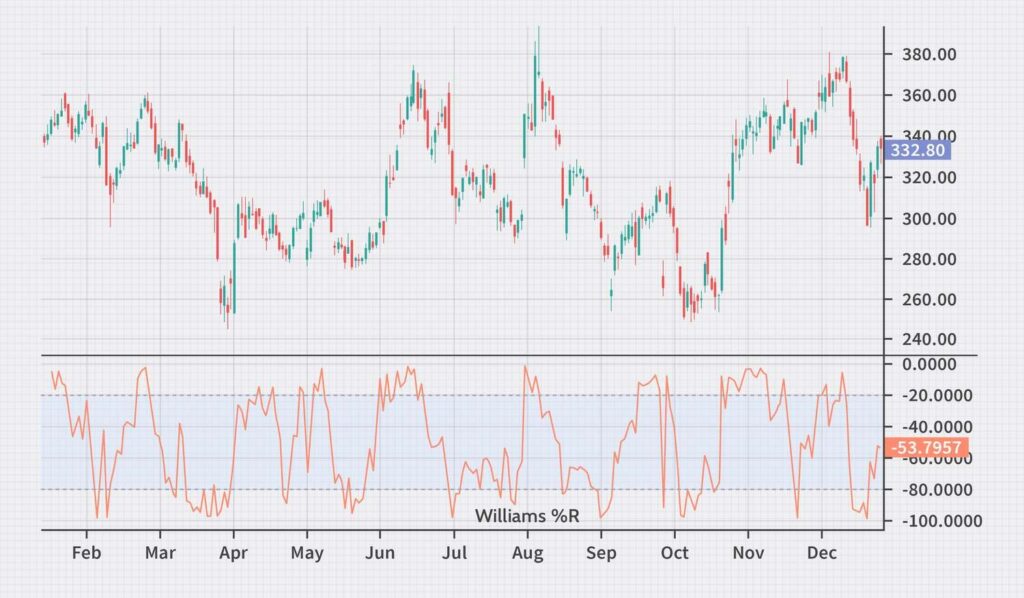
Williams %R, an important oscillator, aids traders in identifying overbought or oversold market conditions within a specific timeframe, typically 14 periods. The indicator provides a numerical value between -100 and 0, with values approaching -100 indicating oversold conditions and values nearing 0 indicating overbought conditions.
Traders utilise these readings to make timely decisions, potentially entering a trade when the market is oversold and exiting or shorting when it’s overbought.
The Average Directional Index (ADX) is a pivotal indicator for traders, measuring the strength of a market trend. It provides a numerical value typically between 0 and 100, with higher values indicating a stronger trend.
When the ADX value is low, it suggests a weak or absent trend, aiding traders in identifying ranging markets. Conversely, a high ADX value signifies a robust trend, assisting traders in assessing the potential for trend-based trading strategies.

To optimise chart indicators for effective trading:
In conclusion, understanding popular chart indicators is a crucial step for non-professional traders aiming to enhance their Forex trading strategies. By leveraging these indicators effectively, traders can make informed decisions and navigate the Forex market with increased confidence. Experiment with different indicators and find the ones that align with your trading style and goals, ultimately enhancing your trading success. Best of luck with your trades!
![]()
Follow us on:


