In ancient Japan, there was a brilliant rice trader named Munehisa Homma. He had a unique talent for predicting future price movements in the rice markets. How did he do it? Well, he closely observed market prices and studied the emotions of fear and greed among traders. This keen observation led him to create something groundbreaking – the candlestick chart.
Homma’s candlestick chart displayed the open, high, low, and close prices over specific time periods, giving traders a visual representation of price movements. This innovation caught on quickly and spread throughout Japan, revolutionising trading.

Fast forward to the late 19th century when Charles Dow, a co-founder of Dow Jones & Company and the Wall Street Journal, encountered Japanese candlestick charting. Impressed by its potential, he brought it to the Western world, where it further evolved.
Over time, Technical Analysis, as it came to be known, saw the addition of the Elliott Wave Theory and benefited greatly from advancements in technology. Traders gained access to sophisticated charting software and a wide range of technical indicators.
Today, Technical Analysis remains a favoured approach in Forex trading. It allows traders to make informed decisions based on data-driven insights, empowering them to navigate the dynamic and ever-changing markets with confidence.
Imagine being a detective, deciphering hidden clues in the financial market to predict its next move. That’s precisely what Technical Analysis does for traders! It’s a fascinating discipline that involves diving into historical market data, with a keen focus on price charts and trading volumes. But wait, there’s more!
While Fundamental Analysis looks at economic indicators and financial reports, Technical Analysis takes a different route. It operates on the belief that everything you need to know about an asset is already encoded in its price. It’s like the market’s secret language waiting to be decoded.
Traders who wield Technical Analysis skills study the past price patterns, seeking clues and hints about the future. They are the Sherlock Holmes of the trading world, spotting trends and potential trade opportunities with precision.
Through this powerful analytical approach, traders get a glimpse into the market’s underlying sentiment. They understand when it’s giddy with optimism, paralysed by fear, or in the grip of uncertainty. Armed with these insights, they make informed decisions about the perfect moment to enter or exit trades.
So, why does this matter so much? In the fast-paced world of Forex trading, timing is everything. Technical Analysis gives traders the edge they need to navigate through the turbulence of the market, making well-timed moves and staying ahead of the game. It’s no wonder Technical Analysis is a favourite among traders who love the thrill of decoding the market’s mysteries and reaping rewards from their astute predictions.
To navigate the dynamic world of financial markets effectively, traders must grasp the foundational concepts of Technical Analysis. These core principles provide a deeper understanding of market dynamics and empower traders to make well-informed decisions.
Price Charts
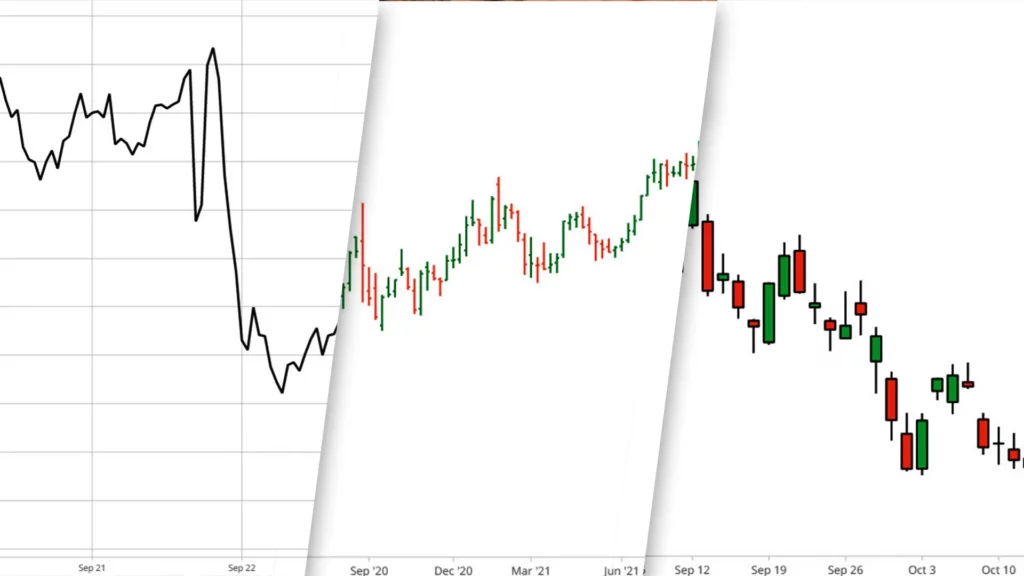
Price charts serve as the bedrock of Technical Analysis, offering a visual representation of historical price movements of currency pairs over specific timeframes. Among the commonly used charts are candlestick and line charts.
Candlestick charts present a wealth of information, revealing open, high, low, and close prices within a designated timeframe. On the other hand, line charts provide a simplified view, showcasing only the closing prices. Understanding these charts enables traders to spot patterns, trends, and potential turning points in the market.

Timeframes
Mastering different timeframes is essential for traders to adapt their strategies to various market conditions.
Timeframes vary from ultra-short periods, such as seconds or minutes, favoured by intraday traders seeking rapid profit opportunities, to longer-term perspectives like daily or weekly, preferred by investors aiming to capture substantial trends.
Analysing price action across multiple timeframes offers a comprehensive view of market behaviour, facilitating well-timed entries and exits.
Support and Resistance
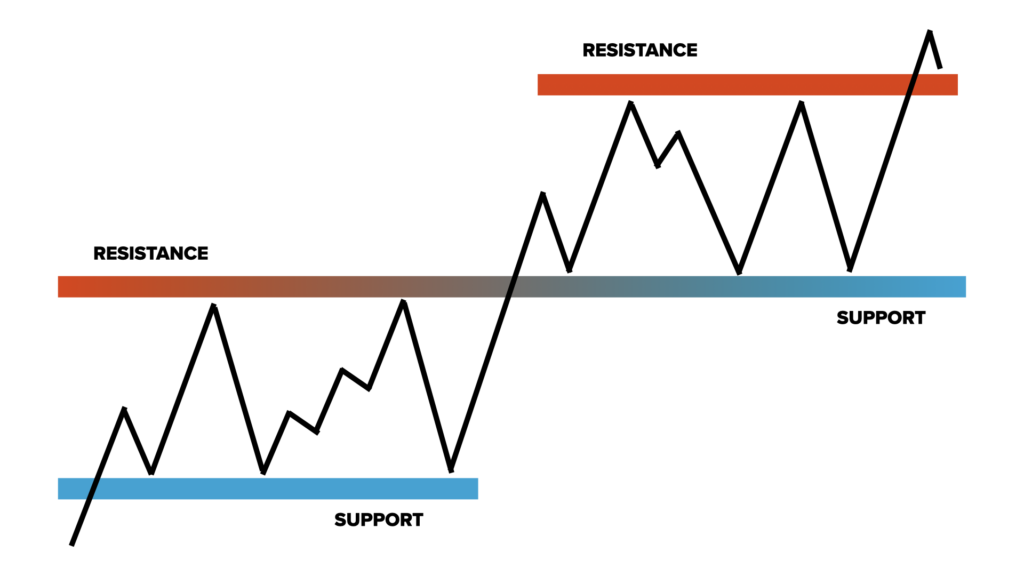
The concepts of support and resistance levels are invaluable tools for traders seeking to identify crucial price levels in the market.

Support refers to price zones where demand is strong enough to halt a downtrend, acting as a price floor. Conversely, resistance denotes areas where supply is abundant enough to prevent an uptrend from continuing, creating a price ceiling.
Recognising these levels empowers traders to make strategic decisions, such as placing stop-loss and take-profit orders and enables them to anticipate potential trend reversals.
Trend Lines
Trend lines are powerful aids in understanding market direction and momentum. By drawing straight lines connecting consecutive peaks or troughs on a price chart, traders gain insights into the prevailing trend – whether it is upward, downward, or sideways.
Trend lines help traders identify key support and resistance levels, confirm trend strength, and anticipate potential breakout or reversal points. Understanding trend lines enhances traders’ ability to ride trends and capitalise on market opportunities.
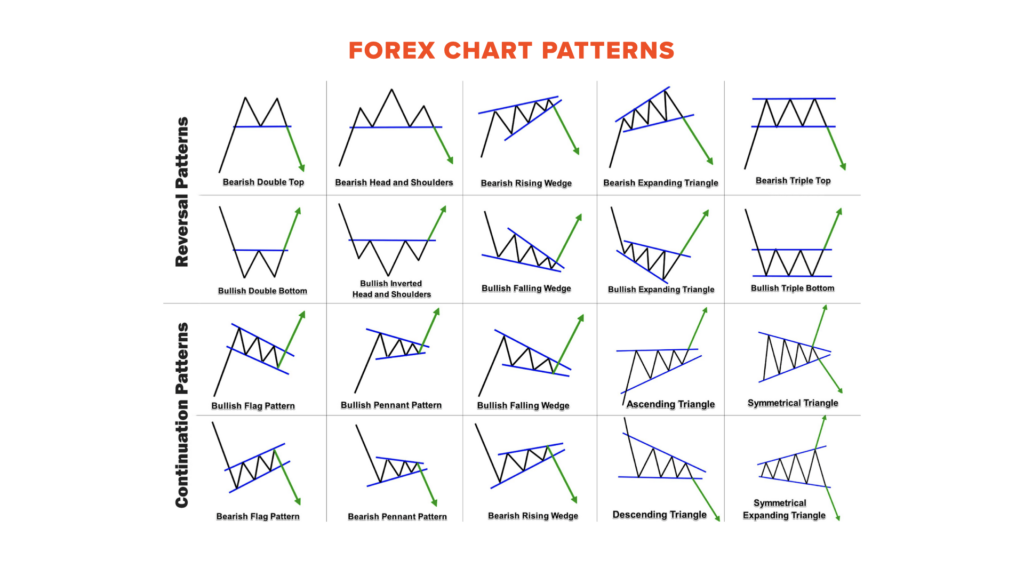
In Technical Analysis, chart patterns play a significant role in providing insights into potential market reversals or continuations. These patterns are recognised for their ability to signal shifts in market sentiment. Let’s explore some common chart patterns that traders frequently encounter:
Technical Analysis encompasses a variety of chart patterns, each carrying its own unique implications. Some well-known patterns include the Head and Shoulders, Double Tops, Double Bottoms, and Triangles. Understanding these patterns can help traders anticipate potential changes in market direction and identify trading opportunities.

The key to effective trading lies in accurately identifying chart patterns. Each pattern provides important information about the balance between buyers and sellers. By mastering pattern recognition, traders can gain insights into potential price targets and develop informed trading strategies.
Moreover, chart patterns are often accompanied by volume trends, which can serve as additional confirmation of their validity. Volume, reflecting the number of shares or contracts traded in a given period, can complement pattern analysis and help assess the strength of signals. Integrating both chart patterns and volume analysis empowers traders to make well-considered decisions when executing trades.
Technical indicators are mathematical calculations derived from price, volume, or open interest data. Their primary purpose is to aid traders in confirming trends, measuring momentum, and identifying potential buy or sell signals.

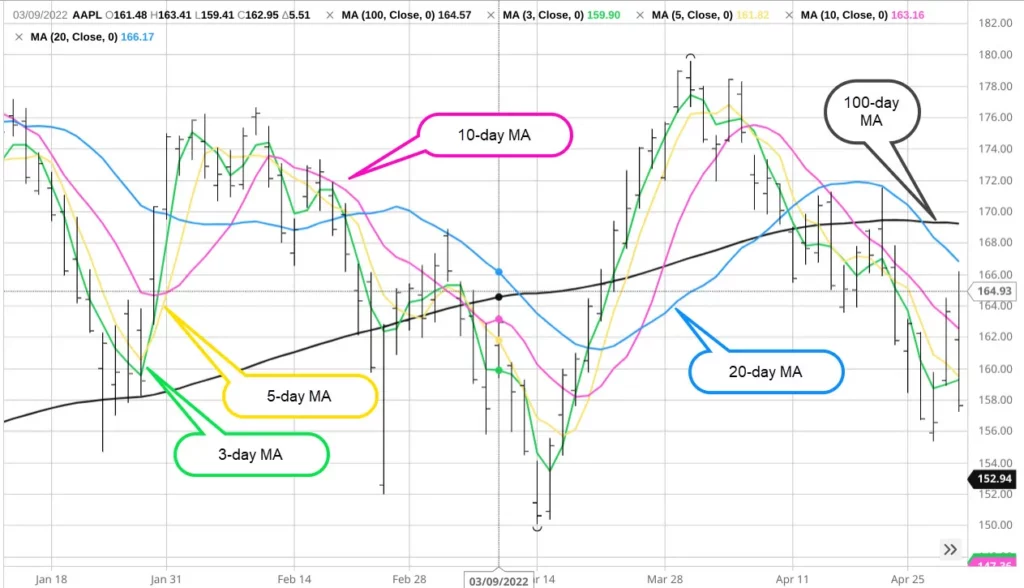
There is an array of technical indicators available to traders, each serving a unique purpose. Moving Averages help smooth out price data and indicate trend direction. The Relative Strength Index (RSI) measures overbought or oversold conditions, while the Moving Average Convergence Divergence (MACD) highlights changes in a trend’s strength and direction.
Interpreting indicators involves analysing their values in conjunction with price patterns and other relevant market factors. Divergence between an indicator and price movement can also provide valuable insights into potential shifts in market sentiment.
Mastering the art of trading involves understanding the strengths and limitations of various analytical approaches. Technical Analysis, a popular method used by traders worldwide, offers its fair share of advantages and drawbacks.
Pros:
Cons:
To leverage Technical Analysis in the Forex market effectively, follow these key tips:
In conclusion, Technical Analysis is an invaluable tool in the world of Forex trading, empowering traders with insights into market trends and potential trading opportunities. By mastering basic concepts, recognising chart patterns, and effectively using technical indicators, traders can make more informed decisions. However, it is crucial to combine Technical Analysis with other analytical methods and apply sound risk management practices to navigate the complexities of Forex trading successfully.