Picture this: you’re standing on the bustling floor of a stock exchange, surrounded by traders frantically waving their arms, shouting buy and sell orders. The numbers on the screens are changing rapidly, and the stakes are high.

In the world of Forex trading, you may not be physically present on a trading floor, but you are part of a global financial arena where billions of dollars change hands every day, all from the comfort of your own computer. To thrive in this dynamic world, you need a powerful tool – Forex charts.
Just as a skilled trader uses charts to decipher market movements amidst the chaos of a trading floor, Forex traders rely on various types of charts to navigate the ever-shifting currency markets. These charts are your compass, helping you make sense of price fluctuations and guiding you toward profitable decisions.
In this guide, we’ll demystify the world of Forex charts, ensuring you’re well-prepared to embark on your trading journey.
Forex charts are visual representations of the price movements of currency pairs in the foreign exchange market. They are a trader’s primary tool for analysing and understanding market dynamics. These charts display historical price data, and by examining this data, traders can make informed decisions about when to buy or sell currencies.
Forex charts act as a historical record of a currency pair’s performance, showing how its value has changed over time. Think of them as the equivalent of a weather map for traders, helping you anticipate market conditions and plan your trading strategies.
The importance of Forex charts cannot be overstated, especially for beginners. Here’s why they are absolutely essential in your trading journey:
Forex charts come in various formats, and each type offers a unique perspective on the market. Here’s a closer look at the three main types:
Each type of chart has its strengths and is suitable for different trading styles and purposes. As you continue your Forex journey, you’ll explore these chart types in more depth and discover which one resonates best with your trading style and goals.
Line charts are the simplest and most fundamental type of Forex charts. They present price data as a continuous line that connects the closing prices of a currency pair over a specific time period. These charts offer a straightforward way to visualise the general direction of a currency’s price movement.
Line charts are often favoured by beginners due to their simplicity and ease of use. They are a great starting point for those new to Forex trading, providing a clear overview of price trends without overwhelming details.
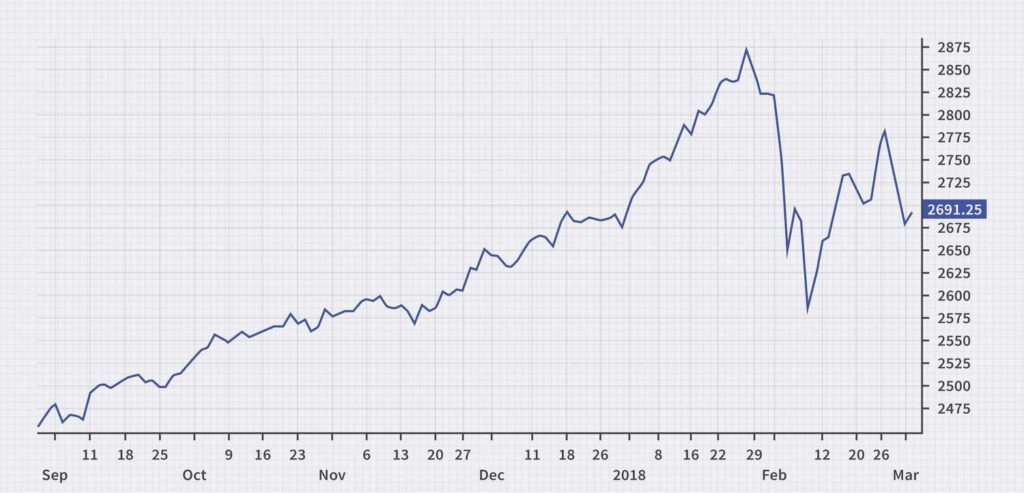
Reading a line chart is akin to connecting the dots on a graph. Here’s how you can read and interpret a line chart:
In summary, line charts are a beginner-friendly tool that helps traders grasp the overall trend of a currency pair quickly. While they lack some of the detail offered by other chart types, they serve as an excellent starting point for those new to Forex trading.
Explore bar charts, candlestick charts, timeframes, and charting periods in Part 2 of this article.
![]()
Follow us on:


