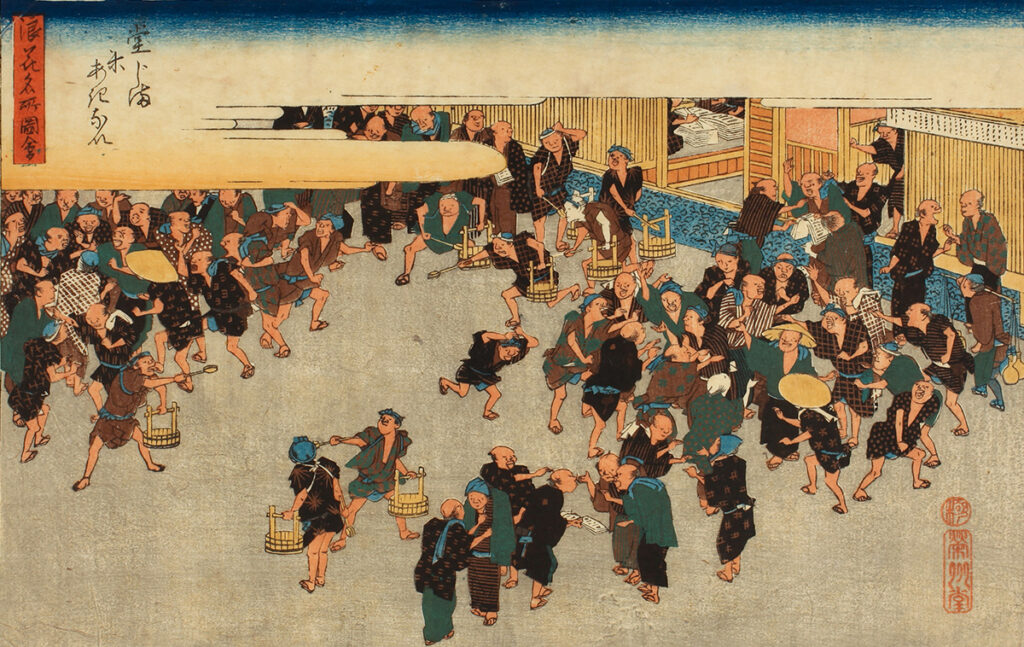
The story of Japanese candlesticks unfolds in 18th century Japan, a time when rice trading was a pivotal economic activity. Merchants and traders required a reliable method to analyse and predict price movements of rice, a commodity of immense importance. This necessity led to the development of what we now know as Japanese candlesticks.
Dojima Rice Exchange in Japan, 18th century source: JPX
Japanese traders, in their quest for a more intuitive and visual way to interpret market movements, created a graphical representation that would later revolutionise the world of financial analysis. The candlestick charting technique was born, allowing them to observe the price action in a structured and insightful manner.
Fast forward to the present day, Japanese candlesticks have become an integral part of technical analysisin financial markets across the globe, particularly in the vast arena of Forex trading. The elegance and effectiveness of this tool have stood the test of time, making it a cornerstone of modern trading strategies.
Understanding Japanese candlesticks is more than just learning about patterns and shapes. It’s about delving into a historical narrative that encapsulates the evolution of financial markets and the human desire to decode the enigma of market behaviour.
By grasping the essence of Japanese candlesticks, traders gain a powerful lens through which they can decipher price movements, enabling them to make informed and strategic trading decisions.
In this guide, we will explore the fundamentals of Japanese candlesticks and equip you with the knowledge needed to navigate the Forex market confidently.
Understanding Japanese Candlesticks
Japanese candlesticks serve as the cornerstone of technical analysis in the realm of Forex trading. These simple yet powerful graphical representations offer invaluable insights into price movements, making them an essential tool for traders.
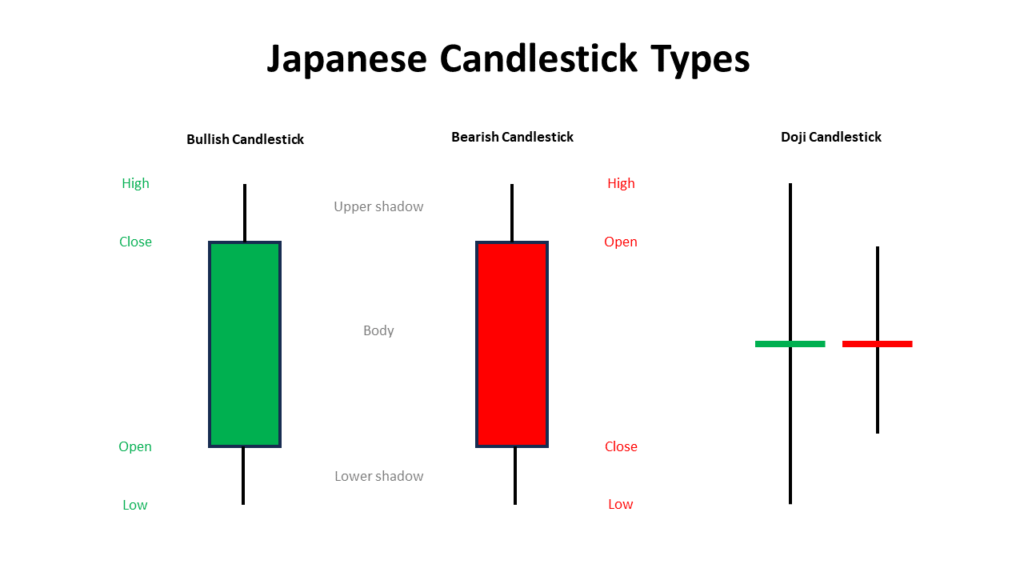
Japanese Candlestick Types
Structure of a Candlestick
A candlestick is like a visual snapshot of the price movement over a specific time period. It encapsulates three crucial components that provide a comprehensive view of market dynamics:
Body: The central, solid part of the candlestick represents the price range between the opening and closing prices during the given time frame. If the closing price is higher than the opening price, the body is typically coloured green or white, indicating a bullish movement. Conversely, if the closing price is lower than the opening price, the body is coloured red or black, indicating a bearish movement.
Wick (Upper and Lower Shadows): The thin lines, often referred to as the wicks or shadows, extend from the body at both ends. The upper shadow denotes the highest price reached during the time period, while the lower shadow represents the lowest price. These wicks help visualise the price fluctuations and volatility.
Shadow: The entire length from the highest point of the upper shadow to the lowest point of the lower shadow is termed as the shadow, signifying the entire price range for that period.
Types of Candlesticks
Candlesticks come in various shapes and forms, each conveying unique market sentiments. They are broadly categorised into three types:
Bullish Candlesticks: These candlesticks signal a price increase during the specified time period. Their bodies are usually green or white, illustrating a positive market sentiment and a potential uptrend.
Bearish Candlesticks: Conversely, bearish candlesticks indicate a price decrease over the designated time frame. Their bodies are commonly red or black, symbolising a negative market sentiment and a potential downtrend.
Doji Candlesticks: The Doji candlestick is a special case where the opening and closing prices are nearly equal, resulting in a very short or non-existent body. Doji candlesticks signify market indecision and often precede significant price movements.
Colour Coding of Candlesticks
Understanding the colour coding of candlesticks aids traders in swiftly identifying market trends and interpreting price movements:
Bullish Candlesticks: Typically, these candlesticks are portrayed in green or white, signifying optimism and an upward price movement.
Bearish Candlesticks: Conversely, bearish candlesticks are usually depicted in red or black, indicating a pessimistic outlook and a downward price movement.
Interpreting Japanese Candlesticks
To effectively utilise Japanese candlesticks in Forex trading, understanding common candlestick patterns and their implications is crucial. These patterns can provide valuable insights into market sentiment and potential trend changes, aiding traders in making informed decisions.
Japanese Candlestick Patterns source: ResearchGate
Common Candlestick Patterns
The Doji candlestick is a significant pattern that signifies market indecision. It occurs when the opening and closing prices are very close to each other, resulting in a candlestick with a very short or non-existent body. Doji patterns suggest that neither buyers nor sellers have gained control, often preceding major price movements.
The Hammer candlestick pattern is characterised by a small body at the top and a long lower shadow, resembling a hammer. It typically occurs after a downtrend and signals a potential price reversal. Hammers indicate that sellers drove the price lower during the session, but buyers managed to push the price up, showcasing potential buying interest.
A Shooting Star candlestick pattern is the opposite of a hammer. It has a small body at the bottom and a long upper shadow, resembling an inverted hammer. This pattern occurs after an uptrend and implies a potential bearish reversal. It suggests that although buyers pushed the price higher during the session, sellers entered the market and pushed the price down, indicating potential selling pressure.
The Engulfing candlestick pattern involves one candle completely “engulfing” the previous one. In a bullish engulfing pattern, the first candle is smaller and bearish, followed by a larger bullish candle. This suggests a reversal in the current downtrend. Conversely, a bearish engulfing pattern occurs during an uptrend, indicating a potential reversal to a downtrend.
A Spinning Top candlestick is characterised by a small body and long upper and lower shadows. This pattern reflects market indecision, showcasing a battle between buyers and sellers. Spinning tops suggest that neither buyers nor sellers were able to dominate, leaving the market uncertain about its direction.
Analysing Length and Shape
Apart from candlestick patterns, the length and shape of the candlestick body and wicks provide additional insights into market sentiment:
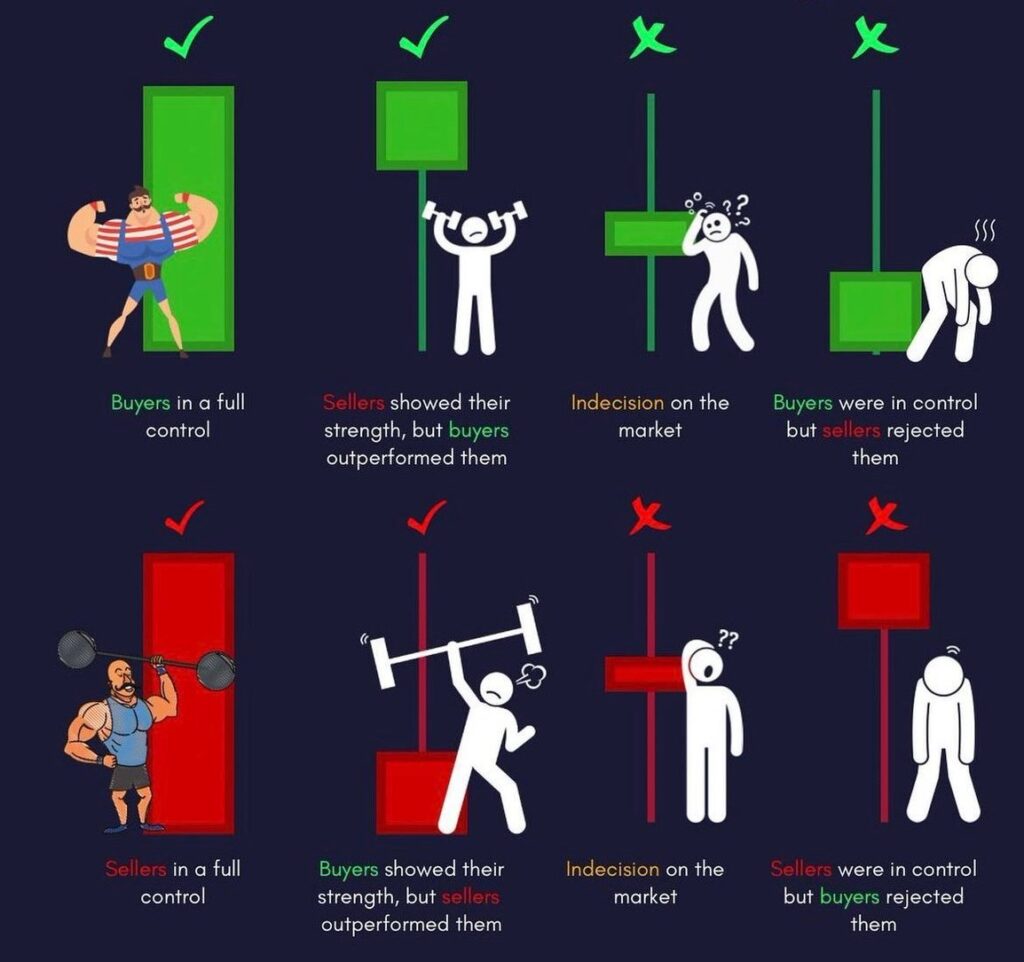
Candlestick Body Length: A long bullish (green or white) or bearish (red or black) body indicates strong buying or selling activity during the session, reflecting market conviction.
Wick Length: Long wicks signify price fluctuations and uncertainty. Longer upper shadows indicate potential resistance levels, while longer lower shadows indicate potential support levels.
Japanese Candlesticks Strength source: priceNpedia on x.com
Applying Japanese Candlesticks in Forex Trading
To leverage Japanese candlesticks effectively in your trading strategy, follow these tips:
1. Identify Trends
Identifying Trend Reversals: Look for reversal patterns like the Hammer or Shooting Star after a prolonged trend. For instance, a Hammer after a downtrend could signal a potential trend reversal to the upside.
Spotting Continuation Patterns: Patterns like Bullish or Bearish Engulfing can suggest that the existing trend is likely to continue. If the pattern aligns with the current trend direction, it provides confidence in holding or adding to a position.
2. Combine with Indicators
Moving Averages: Utilise moving averages to identify the overall trend direction. When a candlestick pattern aligns with the moving average direction, it provides a more robust confirmation of potential market movements.
Relative Strength Index (RSI): RSI is excellent for gauging overbought or oversold conditions. When a candlestick pattern suggesting a reversal aligns with RSI indicating an overbought or oversold market, it strengthens the reversal signal.
3. Set Entry and Exit Points
Entry Points: Use bullish patterns like Bullish Engulfing or Hammer as signals to enter a trade, especially if they align with a trend confirmation from other indicators. Place your entry point just above the high of the pattern.
Exit Points: For exit points, utilise bearish patterns like Bearish Engulfing or Shooting Star. These patterns can indicate potential price declines, prompting you to exit a trade. Set your exit point just below the low of the bearish pattern.
Implement Stop-loss and Take-profit Strategies: Always incorporate stop-loss and take-profit levels to manage your risk effectively. Determine your stop-loss based on the pattern’s low for bullish trades and high for bearish trades. Adjust your take-profit levels based on the potential price movement indicated by the pattern.
Common Mistakes and How to Avoid Them
Avoid these common errors to enhance your candlestick analysis:
Overcomplicating Analysis: Keep your analysis simple and focused on the most essential patterns. Overcomplicating can lead to confusion and poor decision-making.
Ignoring Market Context: Consider broader market trends and economic indicators alongside candlestick patterns to make well-informed trading decisions.
Trading Solely Based on Candlestick Patterns: While candlesticks are powerful, relying solely on them can be risky. Always consider a holistic approach to your analysis.
In conclusion, mastering Japanese candlesticks is a fundamental step towards becoming a successful Forex trader. By understanding their structure, interpreting patterns, and applying them effectively, you can gain valuable insights into market sentiment and potential trends. Avoiding common mistakes and integrating candlestick analysis into a comprehensive trading strategy will set you on the path to success in the dynamic world of Forex trading. Keep learning and practicing to refine your skills and achieve your trading goals.