
The US stock market indices stand as the world’s most widely recognised benchmarks of financial market performance. These powerful indicators not only reflect the health of the American economy but also serve as essential trading instruments for investors worldwide.
With a combined market capitalisation exceeding USD 40 trillion as of 2024, from the venerable Dow Jones Industrial Average to the tech-heavy NASDAQ, understanding these indices is crucial for any trader looking to participate in the global financial markets.
The story of US indices is intrinsically linked to the evolution of modern financial markets. The Dow Jones Industrial Average (DJIA), established in 1896, is perhaps the most historically significant. Initially comprising just 12 industrial stocks with a starting value of 40.94 points, today’s DJIA tracks 30 of America’s most influential companies.
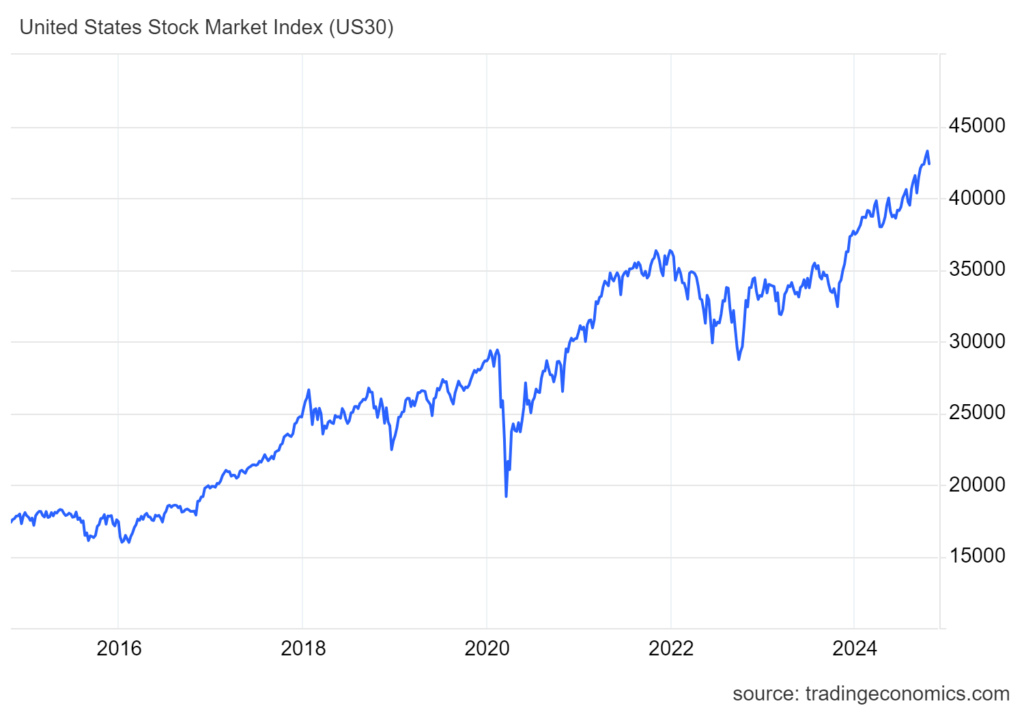
Despite its relatively small composition, it remains a crucial barometer of market sentiment, with components like Apple, Microsoft, and McDonald’s reflecting broad economic trends. The index has shown remarkable growth, surpassing 30,000 points in 2020 – a testament to the long-term potential of US markets.
The S&P 500, introduced in 1957, offers a more comprehensive view of the US economy. Tracking 500 of the largest publicly traded companies, it represents approximately 80% of the available market capitalisation.
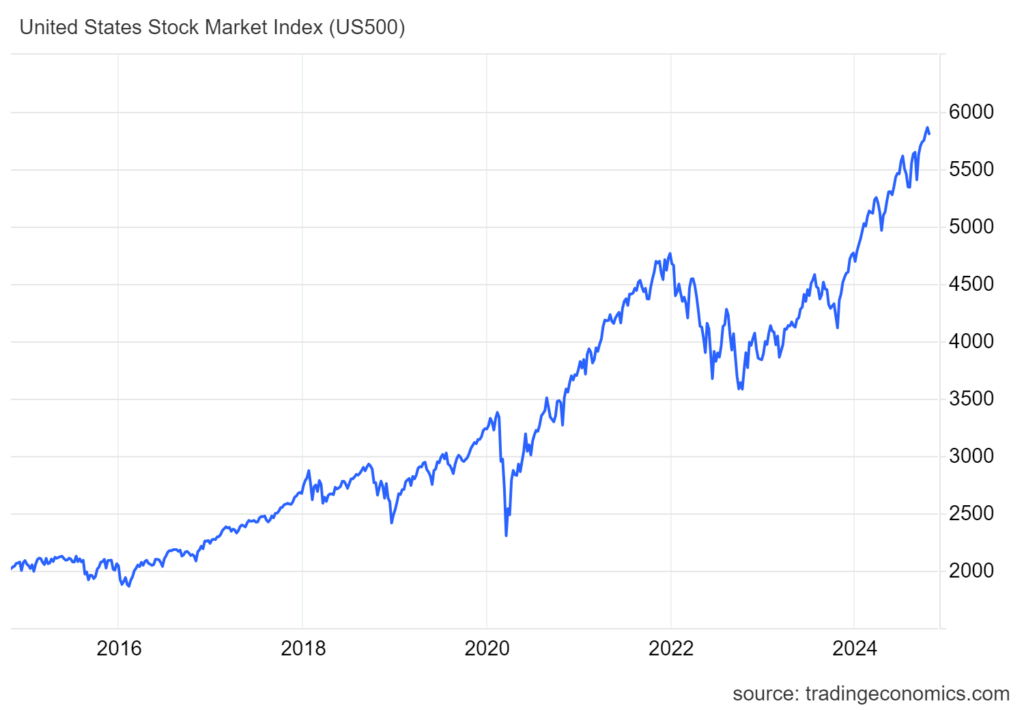
This broader representation makes it the preferred benchmark for professional money managers and institutional investors, with over USD 15.6 trillion in assets directly indexed to its performance.
Notable milestones include breaking the 4,000-point barrier in 2021, highlighting the remarkable growth of US equities over time. The index has delivered an average annual return of approximately 10% since its inception, including dividend reinvestment.
The NASDAQ Composite, launched in 1971, has emerged as the technological revolution’s flagship index. Home to giants like Amazon, Meta, and Alphabet, it represents over 3,000 companies and has become synonymous with innovation and growth.
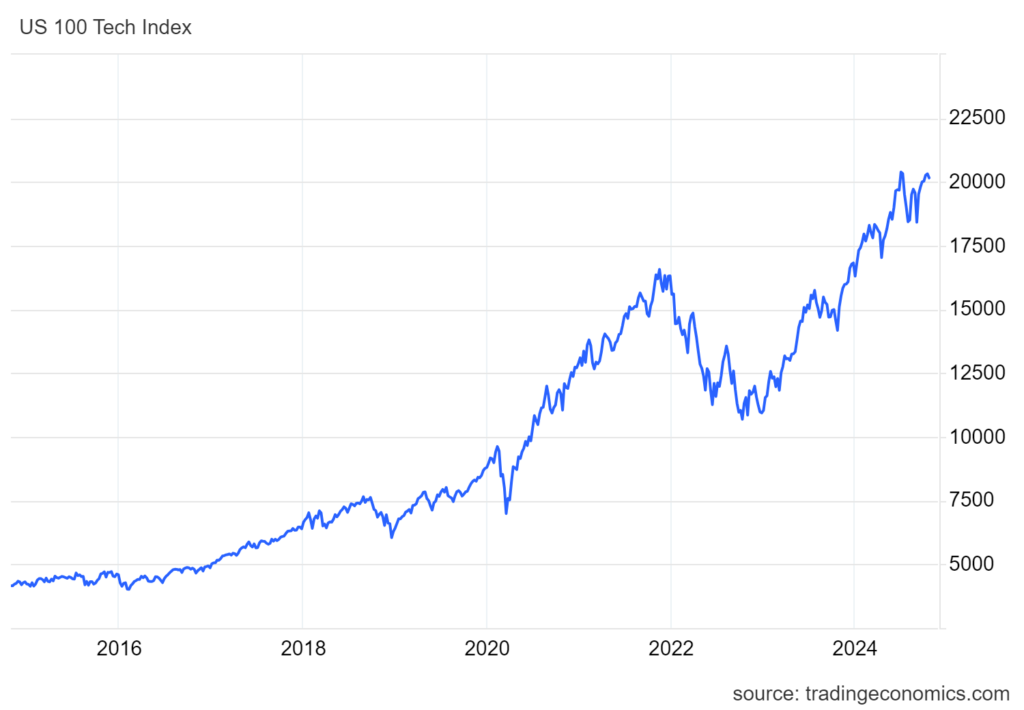
The index’s performance often signals broader technological trends and market sentiment towards high-growth sectors. Since its inception, the NASDAQ has grown from 100 points to over 15,000 points, with technology companies comprising approximately 50% of its total weight.
These indices serve as more than just trading instruments; they are crucial economic indicators. The S&P 500, in particular, is considered a leading indicator of US economic health, with its movements often preceding broader economic trends by 6-12 months. This relationship extends globally, with international markets frequently taking cues from US index movements.
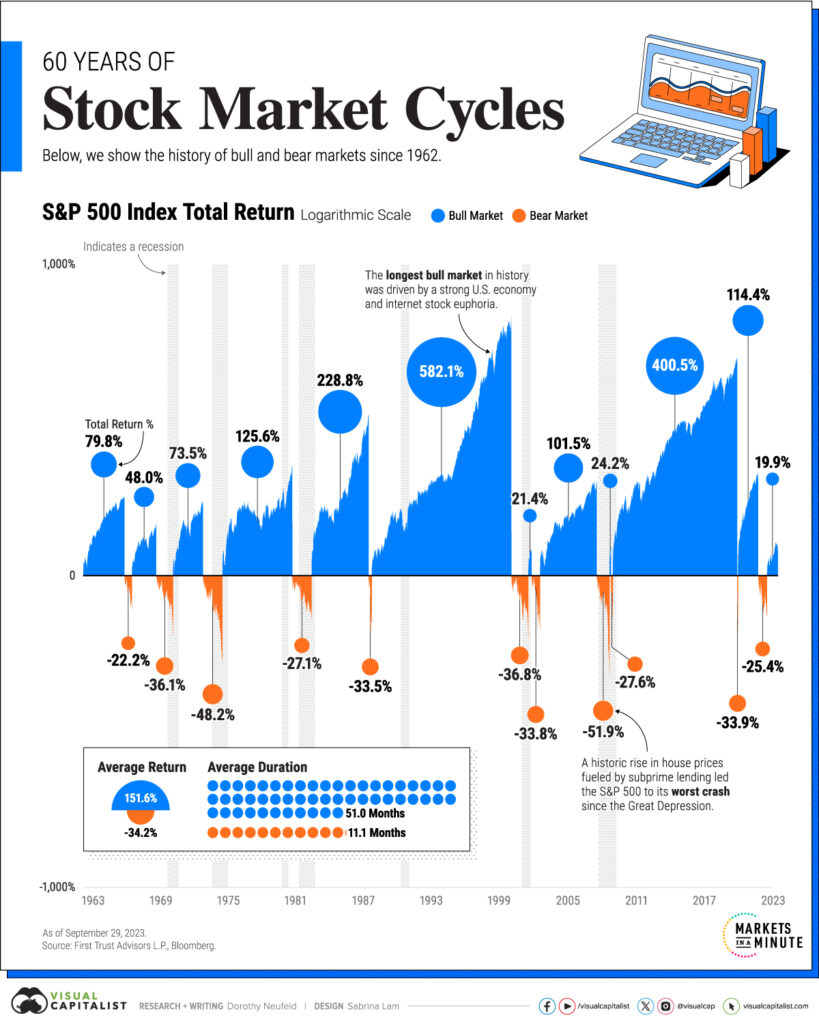
The indices’ influence on global markets cannot be overstated. When Wall Street sneezes, global markets often catch a cold, as demonstrated during significant market events like the 2008 financial crisis, when the S&P 500 fell 38.5%, and the 2020 pandemic-induced volatility, which saw the fastest 30% decline in market history over just 22 trading days.
Trading US indices is accessible through various instruments, with Contracts for Difference (CFDs) being particularly popular among retail traders. CFDs offer advantages including leverage capabilities and the ability to trade both rising and falling markets. However, it’s crucial to understand that leverage, while potentially increasing profits, can also magnify losses.
Trading hours for US indices typically follow the New York Stock Exchange schedule (2:30 PM to 9:00 PM GMT), although many brokers offer extended hours trading from 11:00 PM to 1:00 AM GMT. The pre-market and after-hours sessions can provide additional opportunities but often come with wider spreads and lower liquidity.
Margin requirements for index trading vary by broker and regulatory jurisdiction. VT Markets offers leverage of up to 500:1 on major US indices, meaning traders can control larger positions with a relatively modest capital outlay. For perspective, this means trading USD 100,000 worth of an index could require as little as USD 200 in margin.
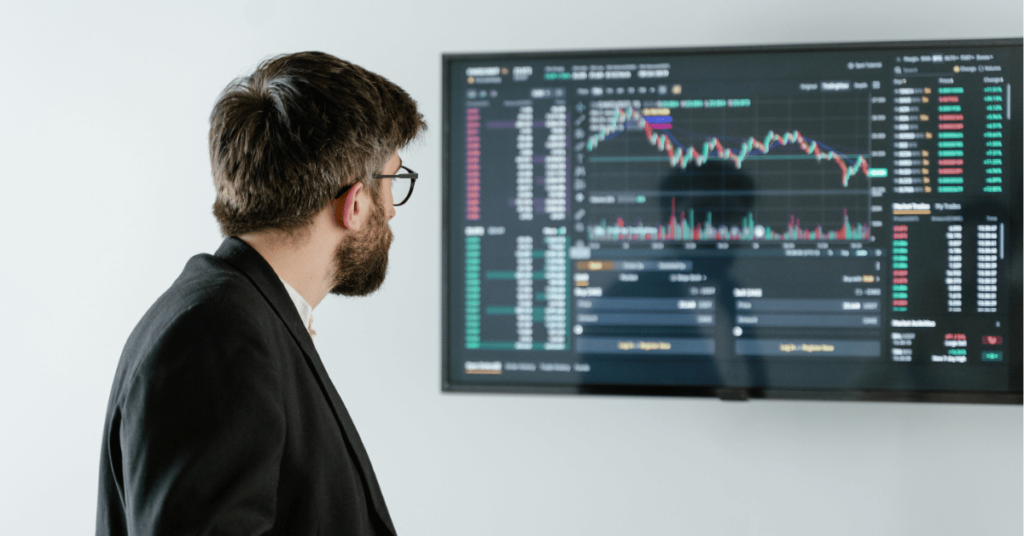
Successful index trading requires a well-thought-out approach combining technical and fundamental analysis.
Technical traders often focus on key price levels, trend lines, and popular indicators like moving averages and RSI. Studies show that approximately 75% of stock price movements are correlated with broader index movements, making index analysis crucial for individual stock traders as well.
Risk management is paramount. Successful traders typically:
Market volatility tends to peak during US trading hours, particularly around economic data releases and Federal Reserve announcements. The first and last hours of trading often see increased volatility, accounting for approximately 35% of daily trading volume.
News impact is significant, with indices responding quickly to major economic indicators such as:
Understanding US indices is crucial for modern traders, but knowledge alone isn’t enough – proper execution through a reliable broker is essential. VT Markets offers competitive trading conditions for all major US indices, including:
Ready to start trading US indices? Open a live account with VT Markets today and gain access to professional trading conditions, educational resources, and dedicated support. Our team of experts is ready to help you navigate the exciting world of index trading with confidence and precision.
Remember, while US indices offer significant opportunities, successful trading requires education, practice, and disciplined risk management. Start your journey with VT Markets and trade with a broker that understands your needs.